In 2006 when I was introduced to buoys in the Chesapeake
Bay by Doug Wilson they stood 14' tall and cost on the order of $150,000 each. $40,000 for the buoy floatation alone.
In 2007 I met the director of the Phytoplankton Monitoring Network where I proposed we monitor water quality 24/7, but how?
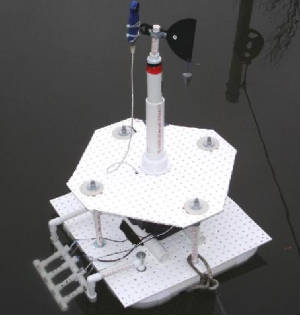
I developed the first Basic Observation Buoy (BOB) using PVC and PASCO sensors. That buoy cost about $1,000 but was an education
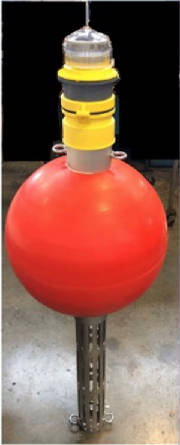
product. Now, with In-Situ's Viewlink, I developed a Pro BOB with sensors that collect and transmit data using 3 D-Cell
batteries... and the data is displayed on www.hydrovu.com. BOB's are being built, improved, and sold... as we speak using
my fabricator, Grieb Associates in Chestertown, MD... check out... www.shoresciences. com. A BOB measuring water temp,
salinity, conductivity, turbidity, DO, and chloro a and transmitting the data costs about $10,000...